


I’ve been becoming increasingly fascinated with data visualization (it’s a major topic in one of my current projects), so when I came across this one TED Talk about a data scientist who created portraits from open source data, I was absolutely amazed. I believe these portraits need more eyes on them, so allow me to share some of them with you (“Insightful human portraits made from data” by R. Luke DuBois, February 2016).
#1: Presidential speeches as eye charts.
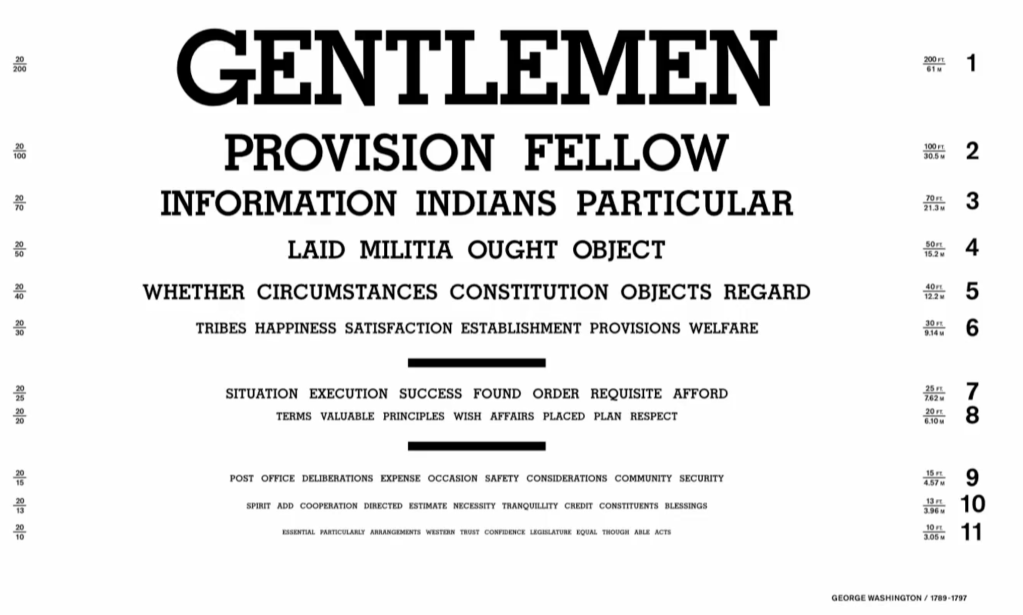
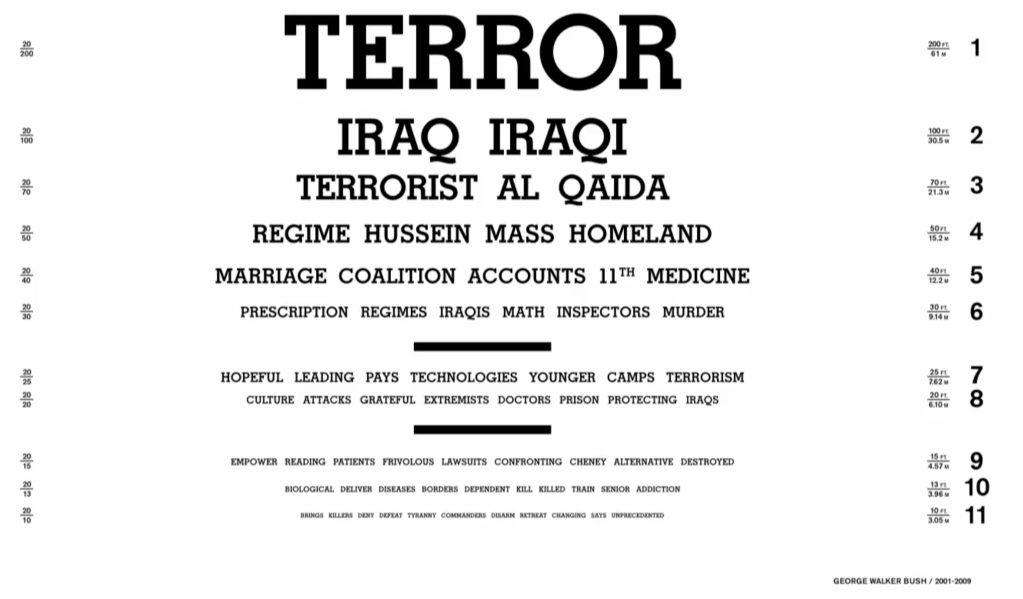
Essentially, DuBois combed through speeches from different United States presidents and ranked the words they used most often on an eye chart, with more frequently said words at the top and less frequently said words at the bottom.
President George Washington (1st, 1789-1797) said “gentlemen” a lot, while President George W. Bush (43rd, 2001-2009) said “terror” a lot. This shows how the rhetoric of American leadership shifts from civility to fear over the centuries, and how language itself can become a mirror of the times.
#2: Characterizing parts of America using dating app data.
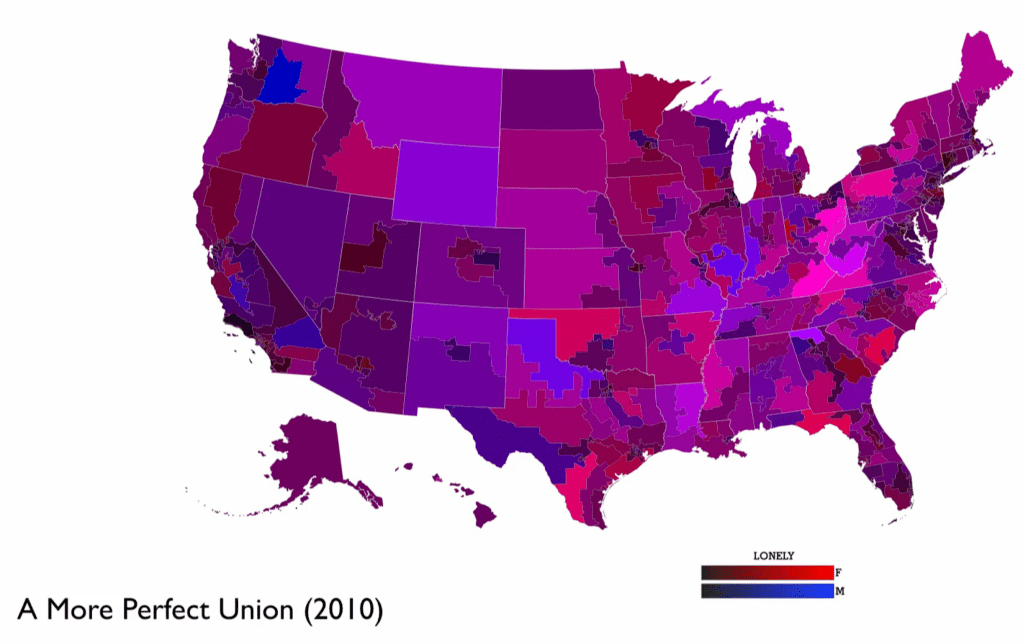
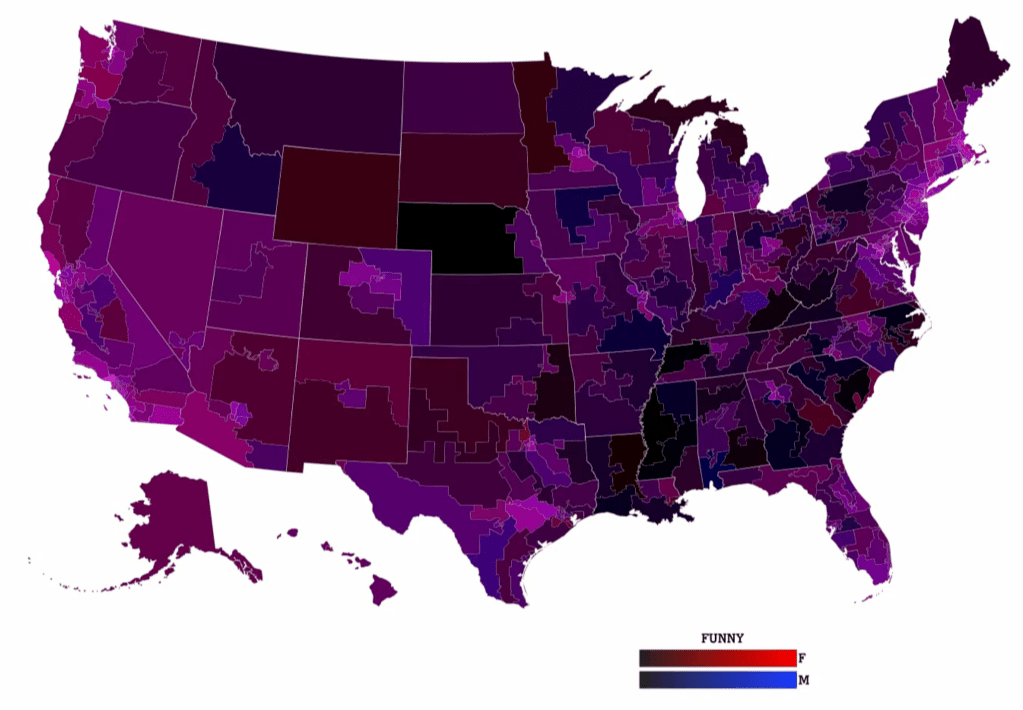
DuBois then used dating app data to find out which parts of America are more lonely and which parts are more funny. Apparently, the people along the Appalachian range are in dire need of a friend. Can someone invite them to their lunch table? But don’t invite the Nebraskans…they don’t seem to have very good comedic timing.
#3: The word each American city uses more than any other city.
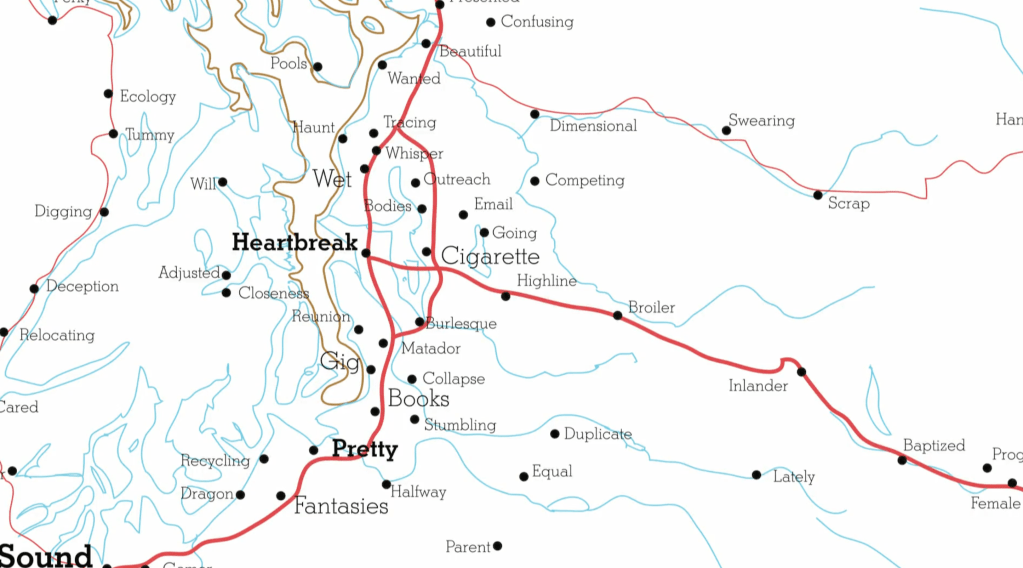
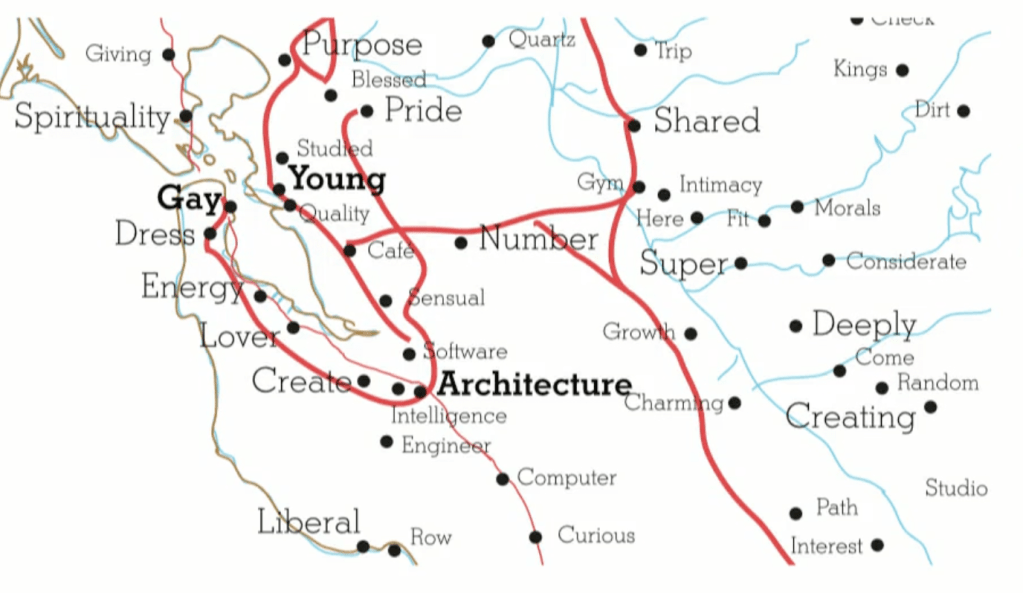
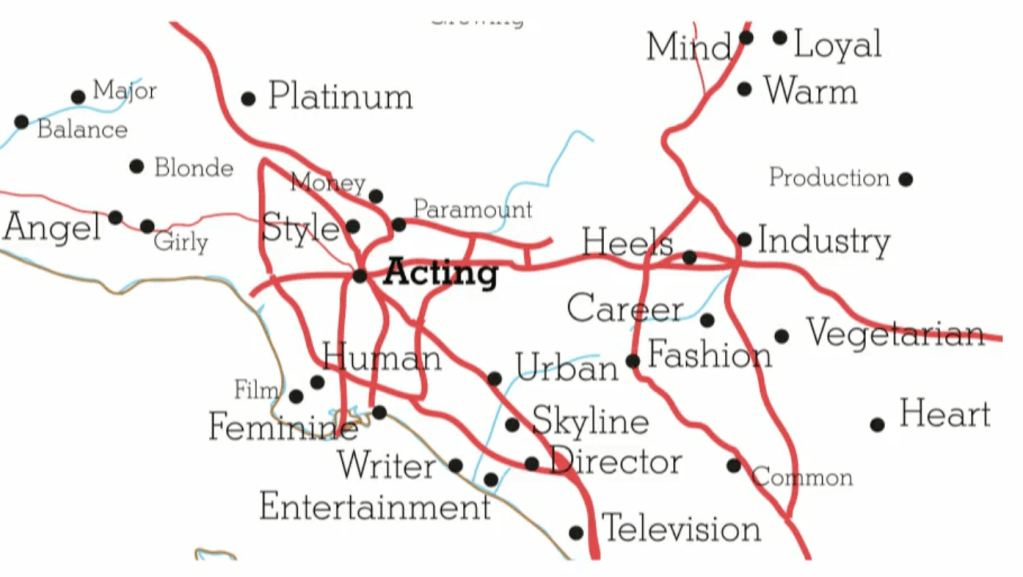
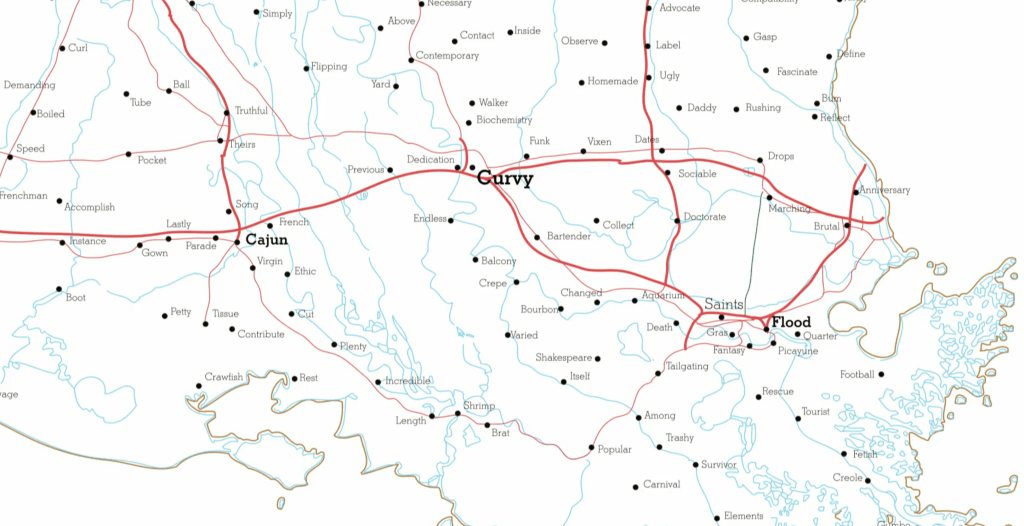
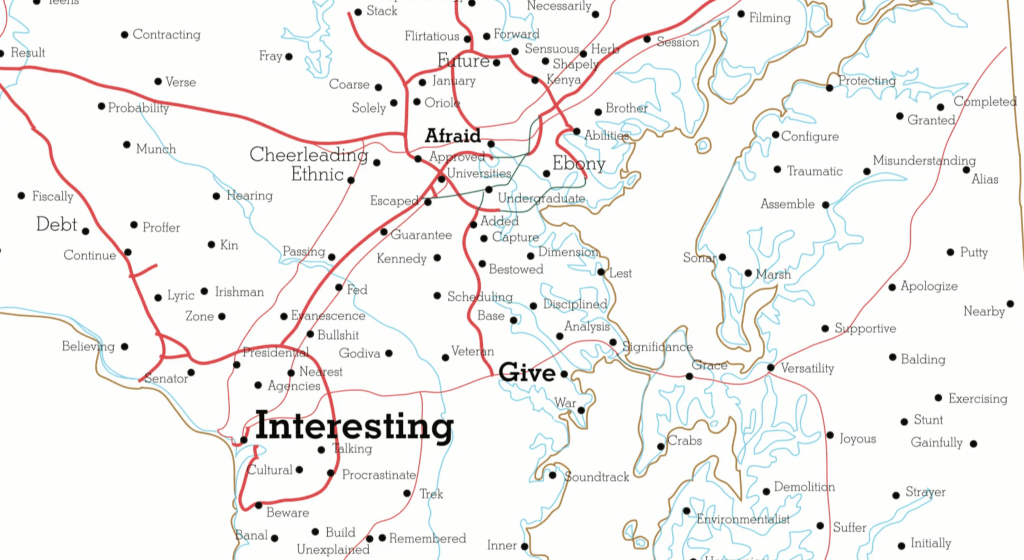
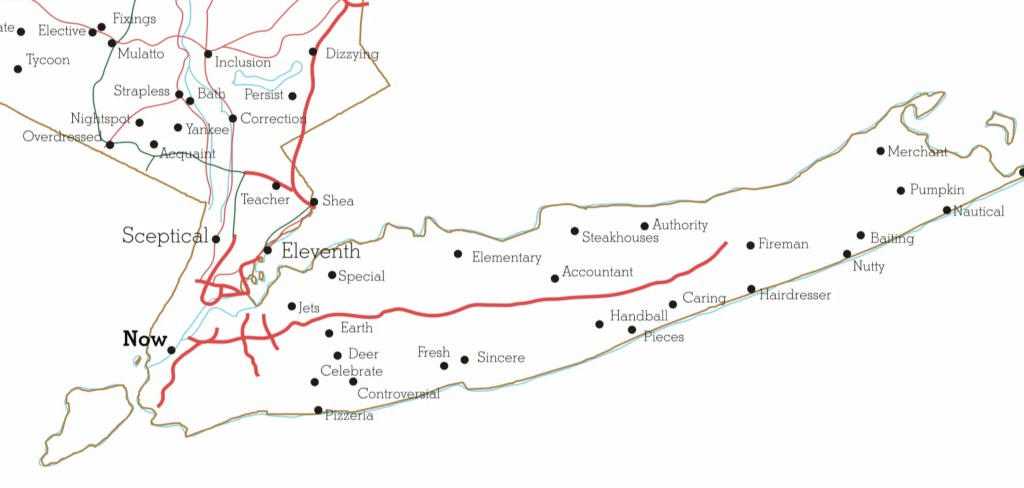
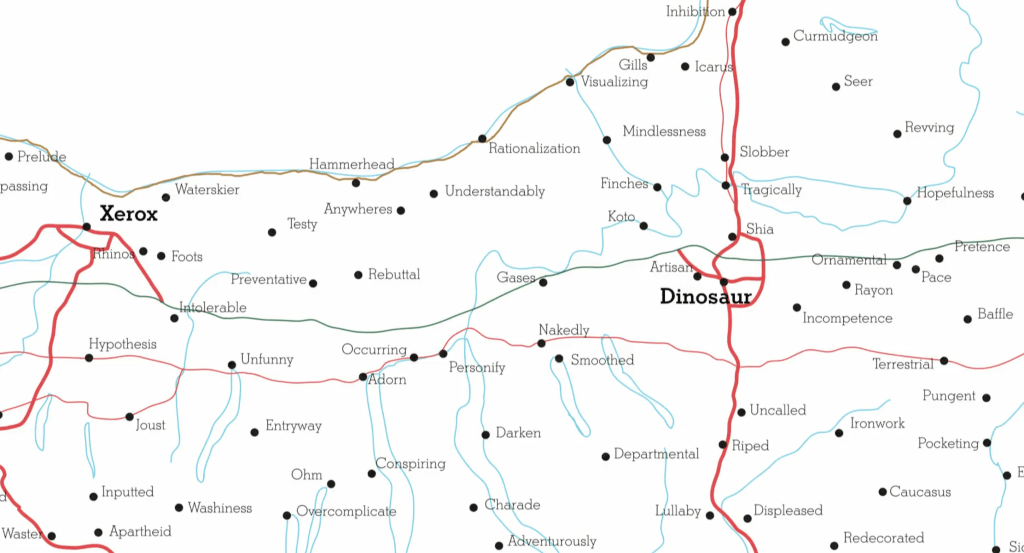
DuBois took his dating app analysis one step further to create a map of America…except this time, each city name was replaced with the one word used in that particular city more than in any other city in the country. The results are pretty amusing.
- Seattle – “Heartbreak” – No wonder Grey’s Anatomy is set in this city. Must be all the rain.
- San Francisco – “Gay” – This actually makes a lot of sense when given historical context. This city is one of the most (if not the most) supportive cities of LGBTQ+ people in America.
- Los Angeles – “Acting” – Do I even need to say anything here?
- Baton Rouge – “Curvy” – Does this indicate high or low levels of body positivity? Either one could result in this word being so common in this city.
- Washington DC – “Interesting” – That right there is the classic politician word for what you call something you don’t like but can’t show your dislike for.
- New York City – “New” – Is this because the word “new” is in the name of the city, and New Yorkers are just talking about where they live a lot? Or maybe New Yorkers just like modern and updated things. I can’t figure this one out.
- Syracuse – “Dinosaur” – I didn’t understand this one at first, but according to DuBois, there’s a pretty famous restaurant chain called Dinosaur Bar-B-Que in this city. The more you know, I guess.
So, there it is. Three examples of the (pretty funny) art you can make with data. Hopefully this convinced at least one person out there that data science is not completely boring.
But all jokes aside, data visualization is one of the most powerful tools in data science—it turns complex, heavy data into aesthetic, easy-to-understand pictures. With data visualization, we can put important data into the hands of the masses both quickly and effectively.
However, there is one important disclaimer about data visualization, and I’ll have to quote DuBois here because I think he said it best: “when you do [data visualization] right, it’s illuminating…when you do it wrong, it’s anesthetizing.”

Leave a comment