

These past few months I’ve been scrolling through some articles about how data science is taught, and I recently came across one that made me consider data beyond just numbers. It reminded me of something we so often forget: data tells stories. Here are some of my thoughts on the article (“10 Ways to Integrate Social Justice into teaching Data Science” by Yim Register, Sep 1st, 2020).
Choosing Meaningful Datasets
Imagine this: you need to choose a dataset for class tomorrow; you don’t have a lot of time, and you just want something that gets the job done. Okay, great. Where are you going first? For me, I’d go straight to Kaggle. So, trust me when I say I 100% relate to the “easy grab” dataset. Difficult as it may be to believe, getting meaningful, relevant data from online is not as easy as it seems. The Internet is expansive, but it doesn’t have everything.
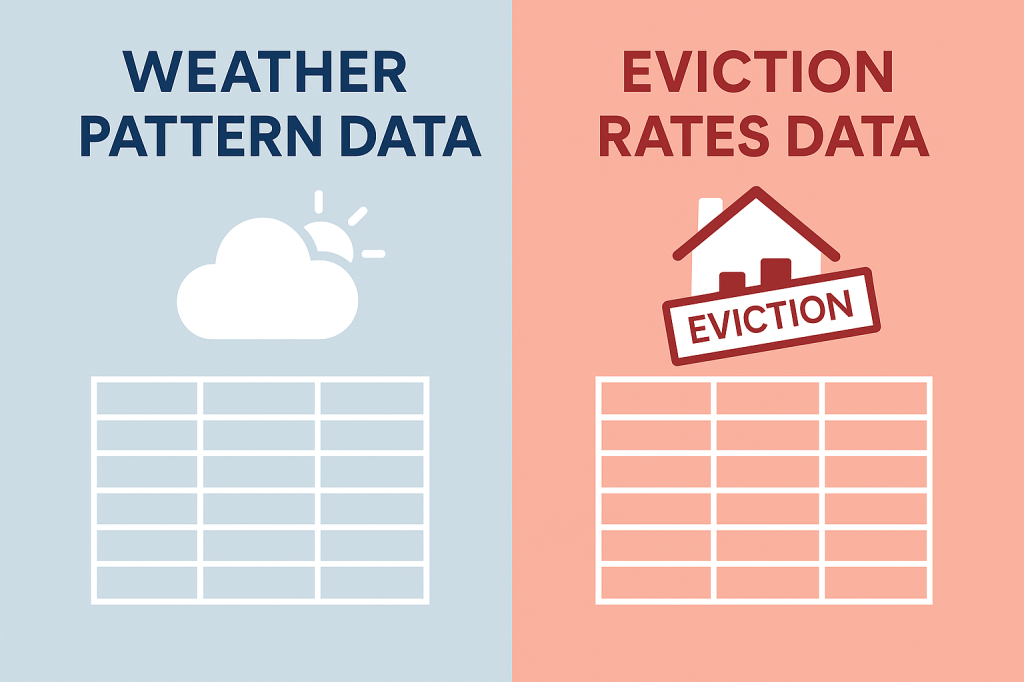
However, Register’s article convinced me that maybe the extra legwork required to find a meaningful dataset is worth the effort. After all, it’s the difference between using a generic, impersonal dataset (like flight records or weather patterns) and a dataset that makes you think about ongoing societal issues (like eviction rates across neighborhoods or wage disparities across industries).
We have to be careful, though, with how we proceed with the use of more “meaningful” datasets. You don’t know whether or not someone in the room has gone through what you’re discussing, and so it’s better to assume there is at least one person who has. After all, assuming zero would just skew your sample. But all jokes aside, caution here is really important.
To avoid insensitivity, while also not shying away from “meaningful” datasets, it’s important to provide warnings about the type of data being discussed ahead of time and to maintain open communication regarding the topic.
Using Data to Tell Stories
Possibly my biggest takeaway from this article is that data are not just numbers, but entire stories. As Register points out, the Titanic dataset (commonly used in data science classes) has a whole story behind it beyond just survival rates: the poor passengers died because the wealthy were allowed to board the life boats first.

So, what a lot of us don’t realize is that this dataset has a whole lesson about classism inherently built into it. I can already think of some ways this could be broached in an actual data science class. For example, you could create a lesson meant to stress the classist discrimination in rescue efforts by setting up a Chi-Squared test of independence into the correlation of a passenger’s wealth class and ability to get on a lifeboat or ultimate death/survival. That would be really interesting, and that way, the numbers would not just teach you about statistics but also about larger scale societal issues.
Ultimately, Register really opened my eyes about how much more we can do with the teaching of data. Between taking the time to choose a “meaningful” dataset and incorporating it in a way that taps into the the data’s backstory, we can teach things like empathy and social justice, making students not just better statisticians and analysts, but also more conscientious people.

Leave a comment